Fabián Medina
Project Manager | Data Analyst | Business Intelligence
Project Manager | Data Analyst | Business Intelligence
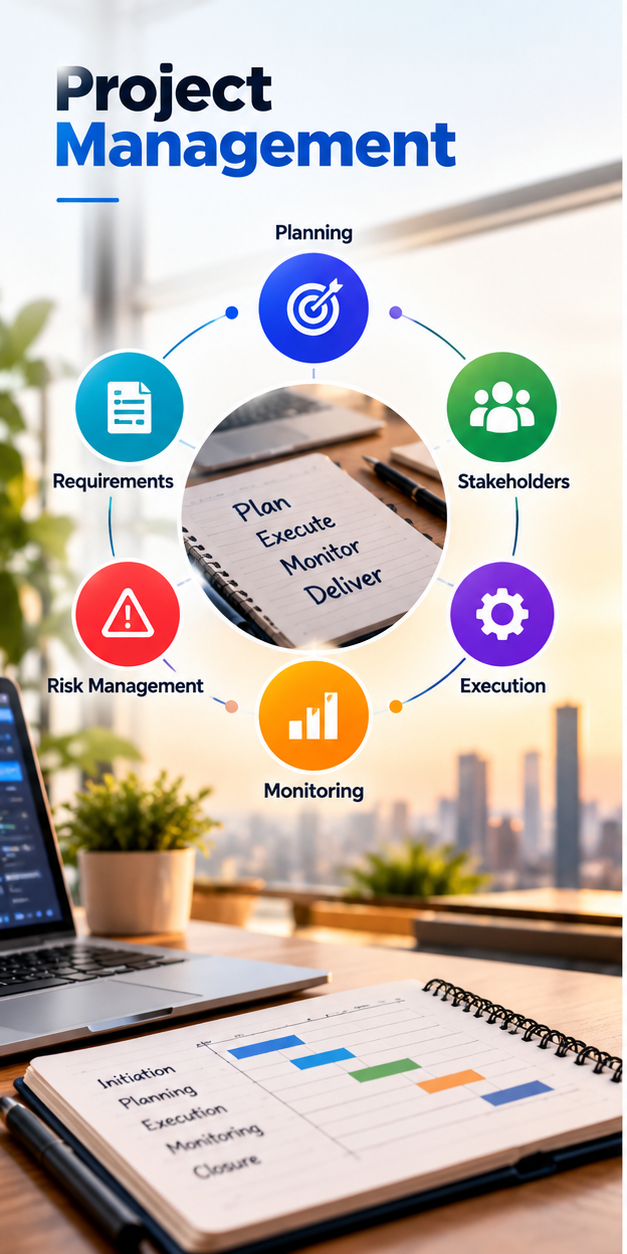
I am a Project Manager and Data Analyst with a degree in Telecommunications Engineering and experience in IT service management, data analysis, and continuous improvement. I combine technical and management expertise to optimize processes and support decision-making. I also have strong skills in coordinating initiatives and analyzing performance indicators.
Experience in project, process, and IT service management, KPI and SLA monitoring, and the application of ITIL best practices. Proficient in ITSM tools such as ServiceNow and Remedy, as well as Jira and Confluence, for managing incidents, problems, changes, service requests, and projects. I also have experience tracking activities, monitoring progress, and ensuring objectives are met.
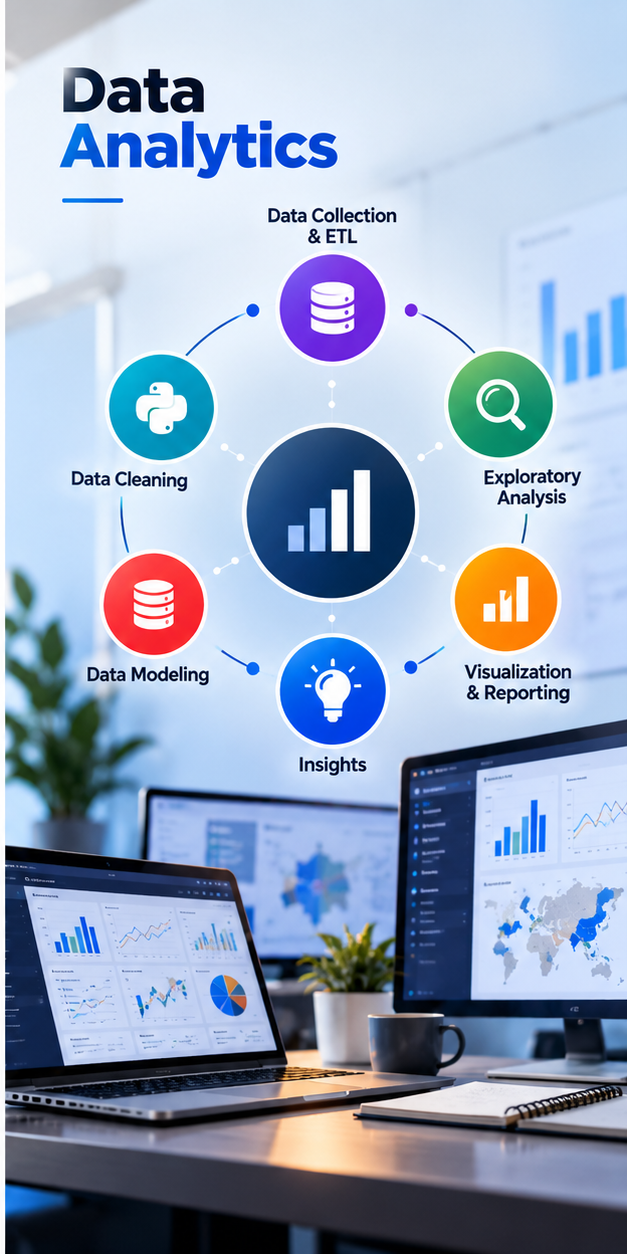
I use Python, SQL, Power BI, Tableau, Pandas, NumPy, and Excel to perform ETL processes, exploratory data analysis, data modeling, and dashboard development. I transform data into clear insights, relevant performance indicators, and actionable findings that support continuous improvement, performance monitoring, and data-driven decision-making.
My background combines project management, IT service management, and data analytics, bridging business needs with results-oriented solutions. I integrate technical analysis with a management perspective to identify opportunities, optimize processes, and generate value for organizations.
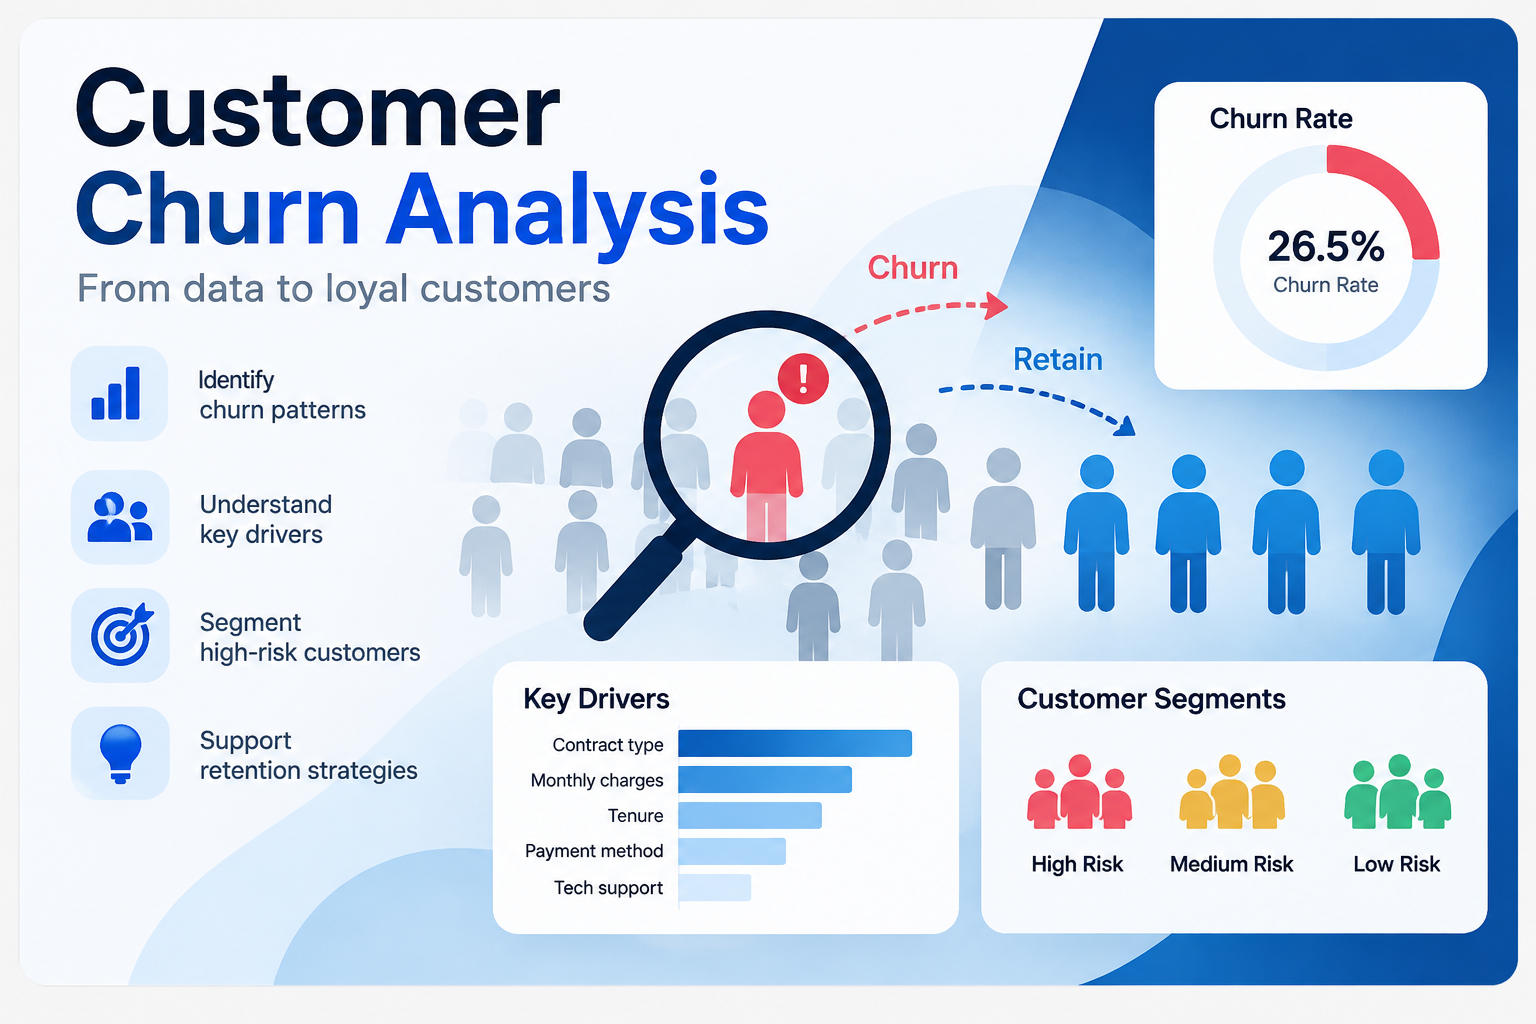
Exploratory Data Analysis (EDA) to identify churn patterns, key drivers, and high-risk customer segments to support retention strategies.
Link project
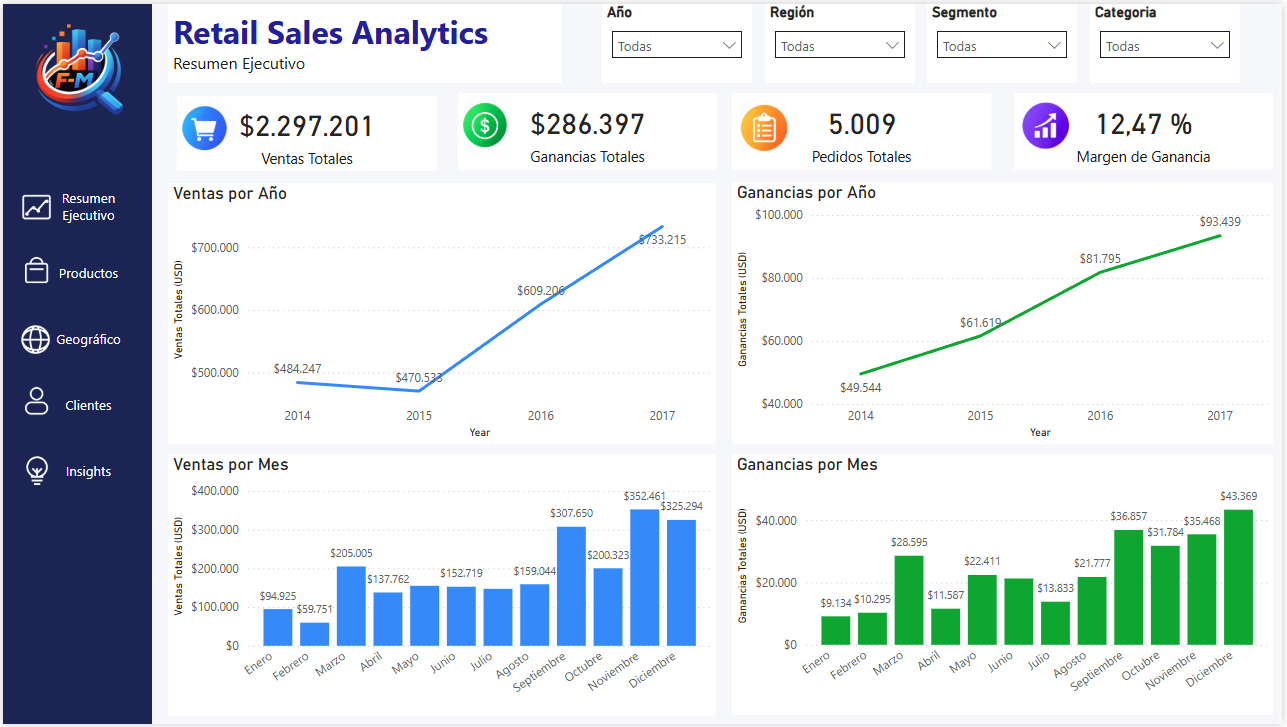
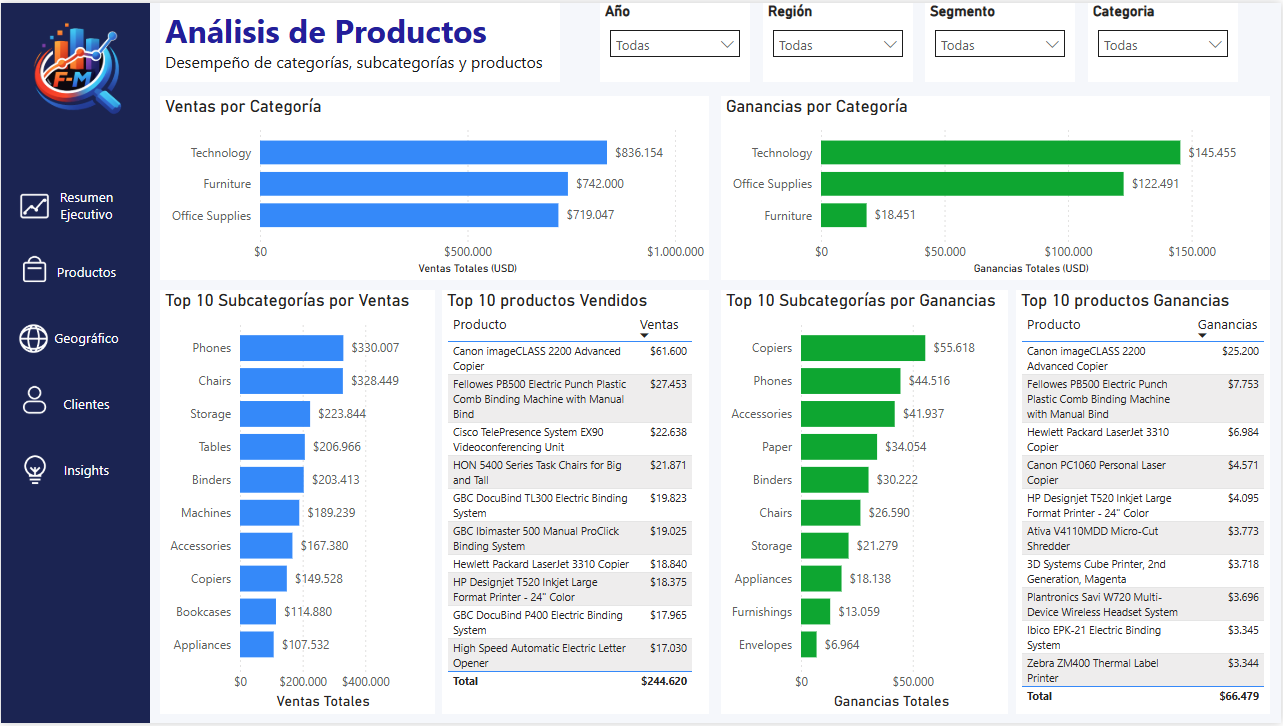
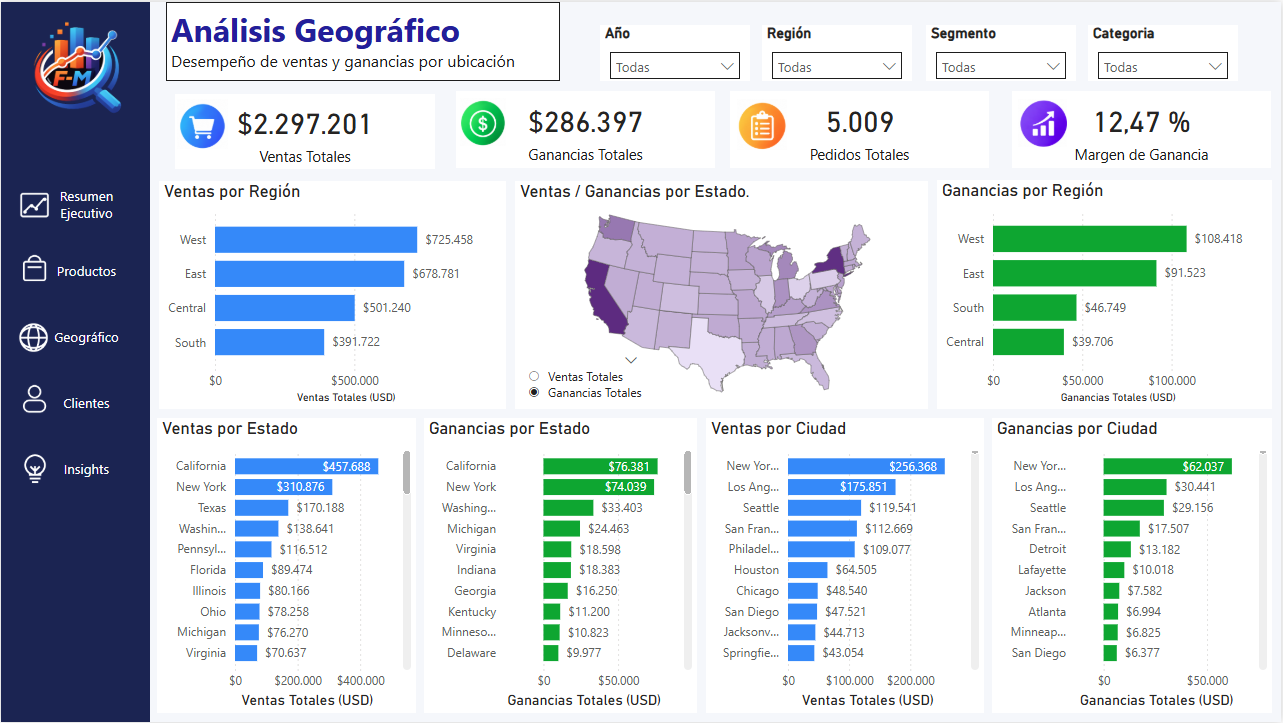
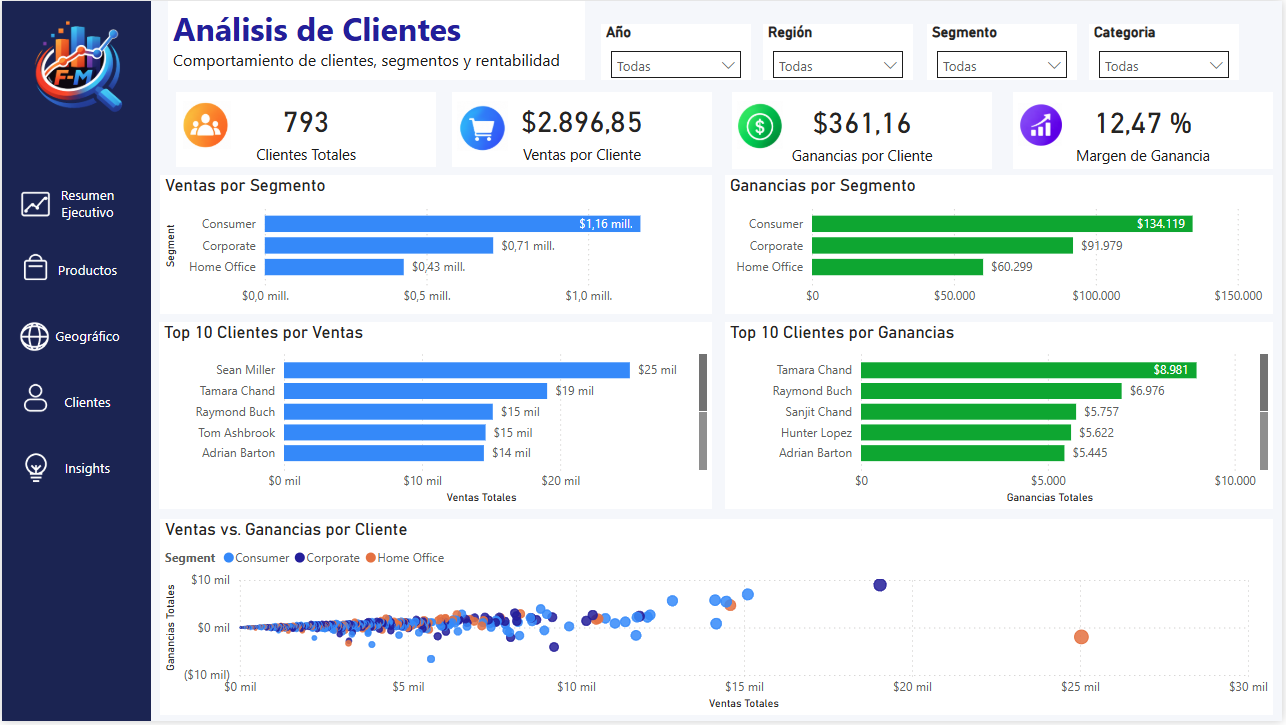
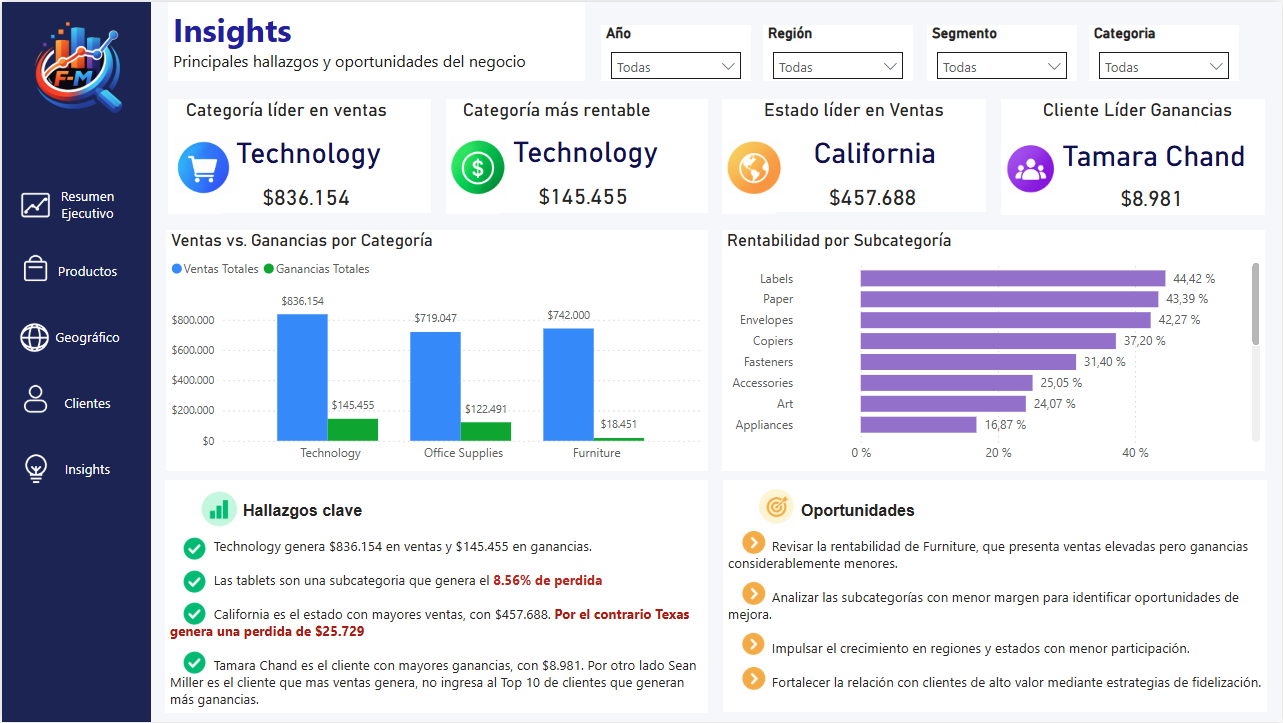
Exploratory Data Analysis (EDA) of over 9,900 retail sales records to identify sales patterns, profitability, customer segments, regional performance, and temporal trends using Python.
Link project
Simulation of a mobile network using 100,000 call records from a company, generated with Python to analyze traffic, KPIs, network congestion and failures.
Link project
Data analysis of an online grocery store to identify purchasing patterns, top-selling products, and customer behavior.
Link project
Analysis of call center operators to identify inefficiencies in missed calls, waiting times, and overall call handling performance.
Link project
Exploratory analysis of video game sales data to identify success patterns, popular genres, and the most profitable platforms.
Link project
Exploratory analysis of taxi trip data to identify demand patterns, peak activity hours, and the most frequently visited areas.
Link projectExploratory Data Analysis (EDA) of over 9,900 retail sales records from 2014–2017. The analysis revealed sustained growth in sales and profit, with 2017 achieving the strongest performance, while Technology was the leading category. West recorded the highest regional performance, and the Consumer segment represented the largest share of sales and profit. The analysis also identified seasonality toward the end of the year, with November standing out as the strongest month.
Simulation and exploratory analysis of over 99,000 mobile call records using Python to evaluate network performance and service quality. The analysis compared 3G, 4G, and 5G technologies through key telecommunications KPIs, including CSSR, dropped call rate, and congestion rate. 5G achieved the highest call success rate (84.97%), while 3G presented higher levels of dropped calls and congestion. The project also explored call traffic, base station utilization, and network performance to support data-driven monitoring and analysis.
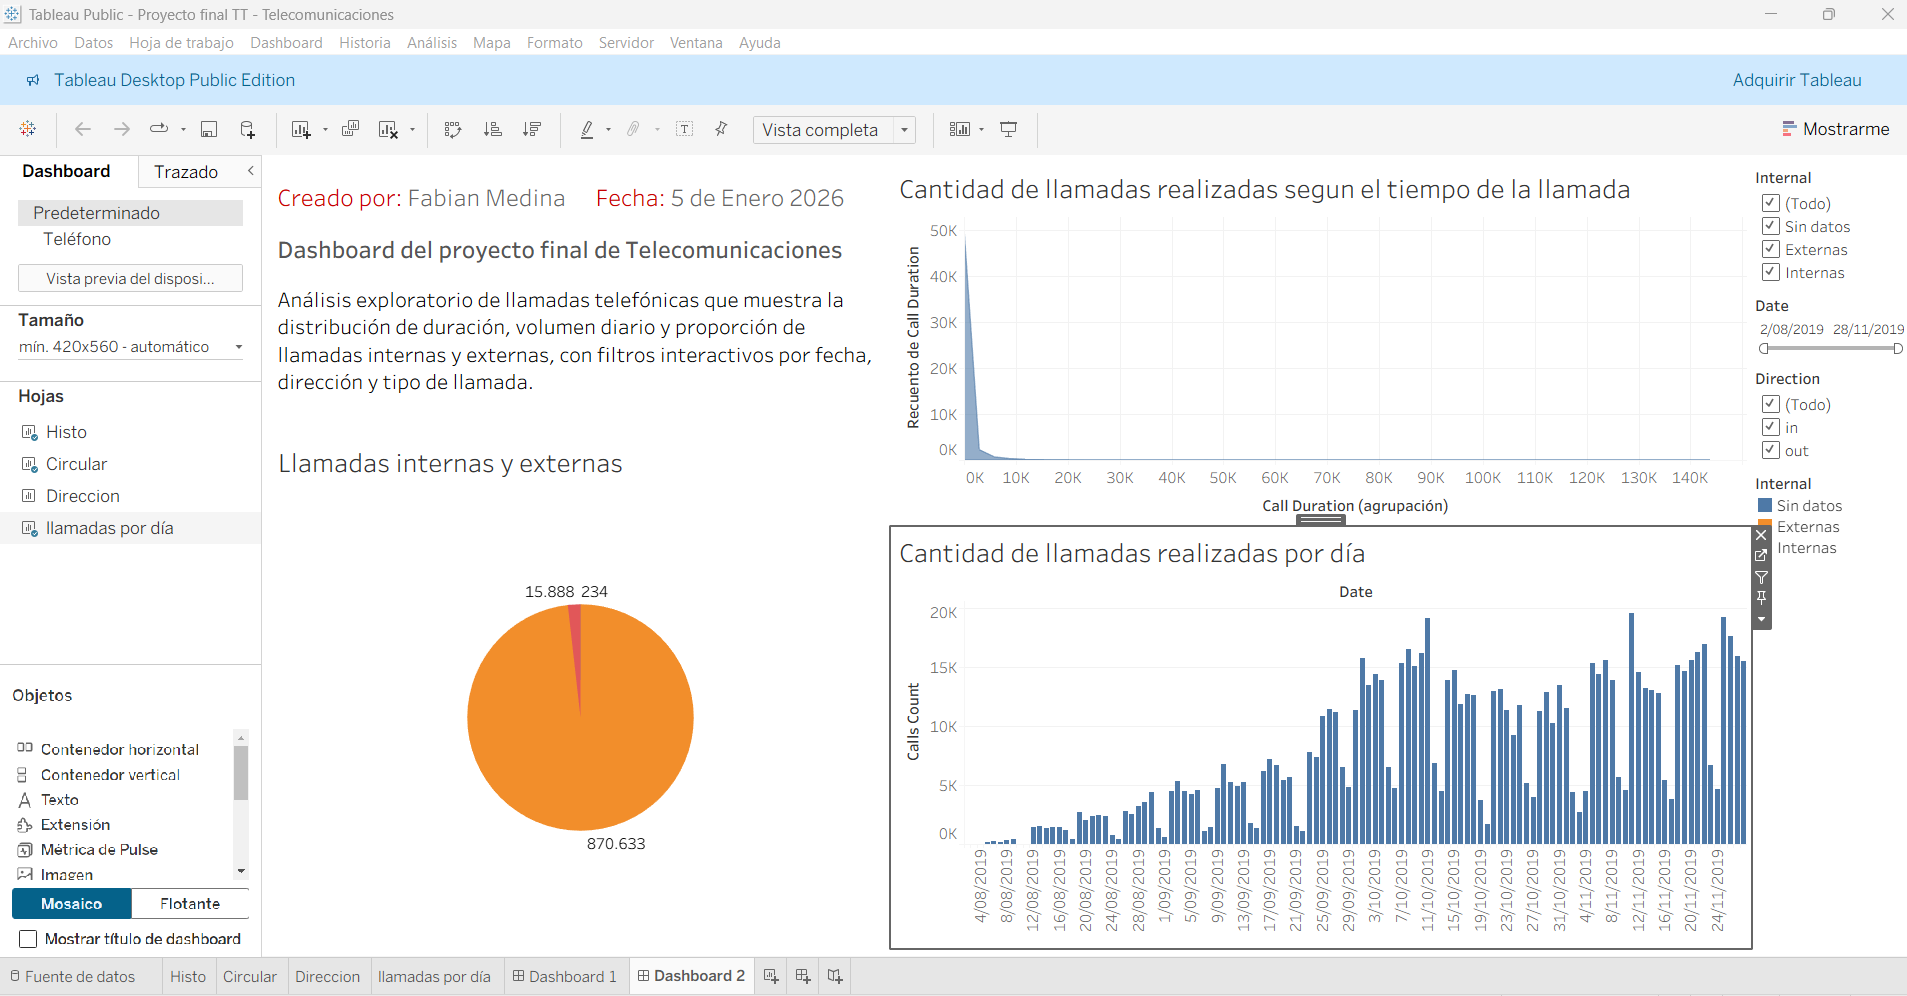
Exploratory Data Analysis (EDA) of over 53,900 call records from the CallMeMaybe virtual telephony service to identify ineffective operators based on missed calls, waiting times, and outbound call activity. The analysis classified 177 operators as ineffective and 113 as effective, using comparative performance metrics and statistical thresholds. Mann–Whitney U tests confirmed statistically significant differences in both average waiting time and missed call rates between the two groups. The findings support targeted training, workload redistribution, and operational improvements.