Fabián Medina
Data Analyst
Data Analyst
I’m a Data Analyst with a background in Telecommunications Engineering and experience transforming data into clear insights that support better business decisions.
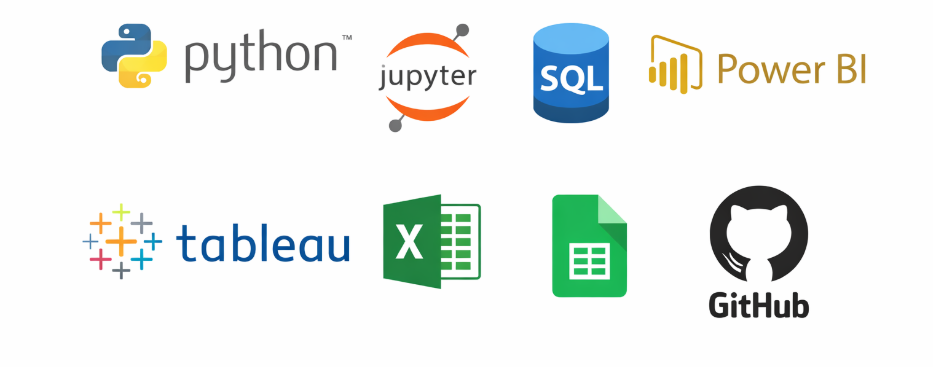
My main focus is data analysis, visualization, and business intelligence, using tools such as Power BI, SQL, Python, Excel, and Pandas to clean, analyze, and visualize data. I enjoy turning complex datasets into intuitive dashboards and actionable insights that help teams understand performance, identify opportunities, and solve problems.
I also have experience in project and process management, working with cross-functional teams, monitoring KPIs, managing requirements, and supporting continuous improvement initiatives. This combination allows me to approach data not only from a technical perspective, but also from a business and project-oriented mindset.
I’m constantly learning and looking for new challenges where I can combine data, technology, and business understanding to create solutions that generate real impact.

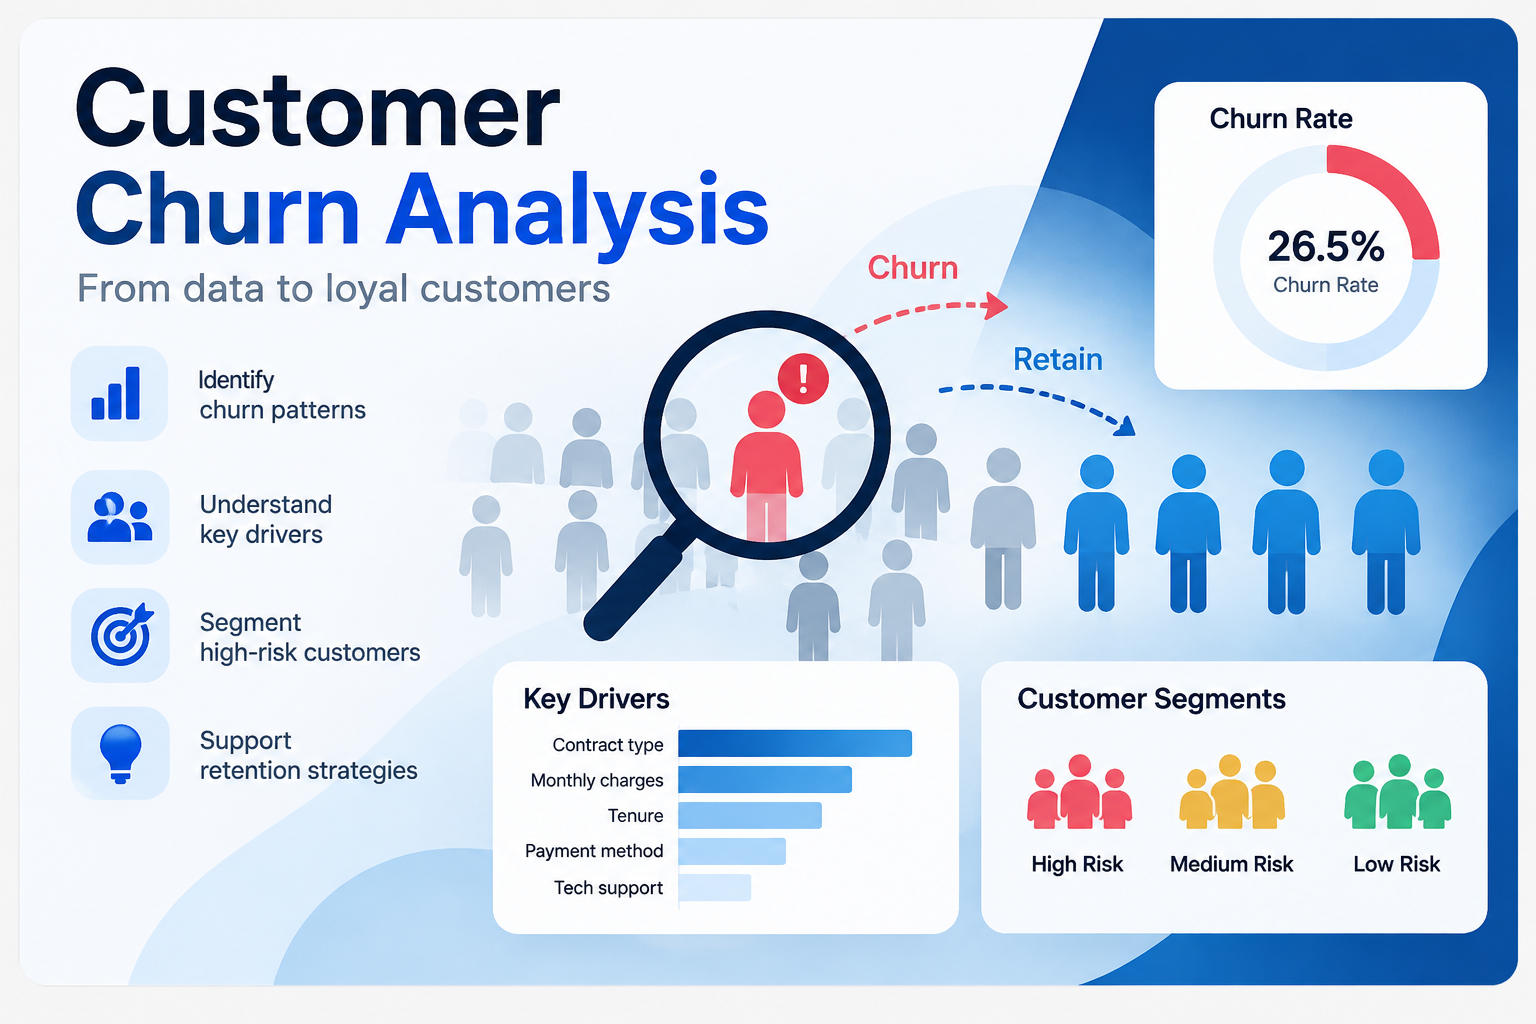
Exploratory Data Analysis (EDA) to identify churn patterns, key drivers, and high-risk customer segments to support retention strategies.
Link project
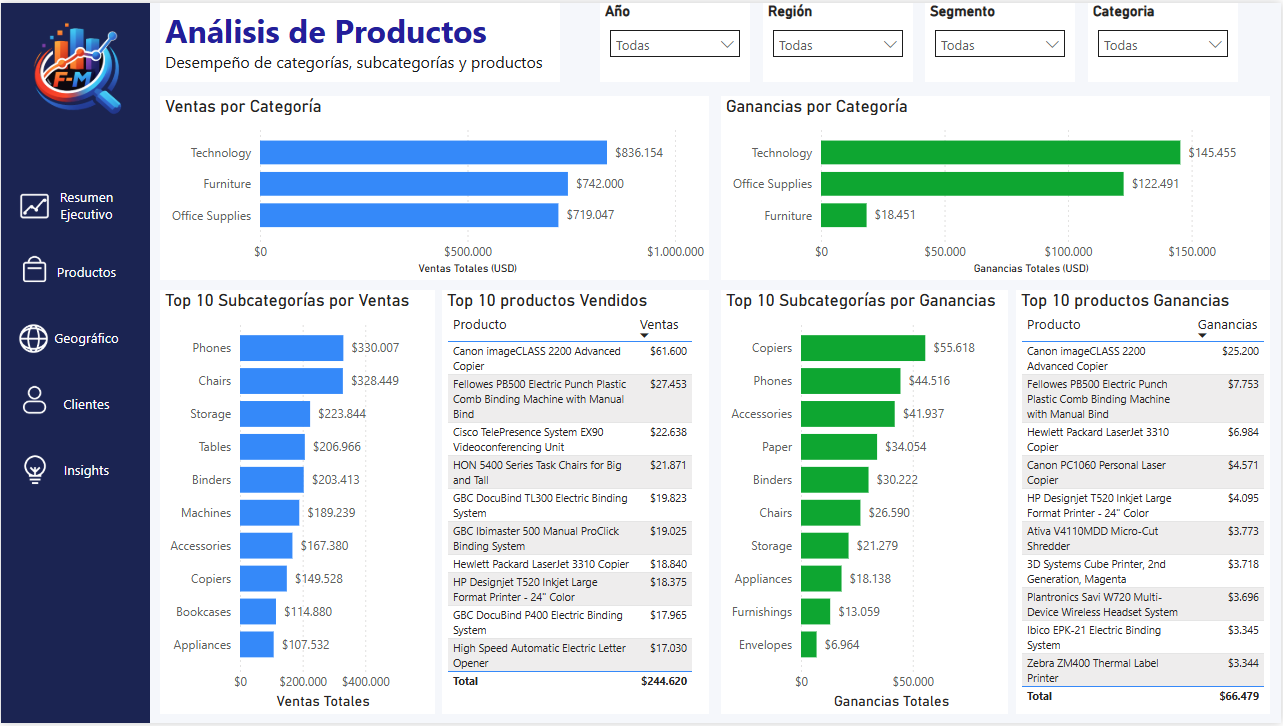
Exploratory Data Analysis (EDA) of over 9,900 retail sales records to identify sales patterns, profitability, customer segments, regional performance, and temporal trends using Python.
Link project
Simulation of a mobile network using 100,000 call records from a company, generated with Python to analyze traffic, KPIs, network congestion and failures.
Link project
Data analysis of an online grocery store to identify purchasing patterns, top-selling products, and customer behavior.
Link project
Analysis of call center operators to identify inefficiencies in missed calls, waiting times, and overall call handling performance.
Link project
Exploratory analysis of video game sales data to identify success patterns, popular genres, and the most profitable platforms.
Link project
Exploratory analysis of taxi trip data to identify demand patterns, peak activity hours, and the most frequently visited areas.
Link project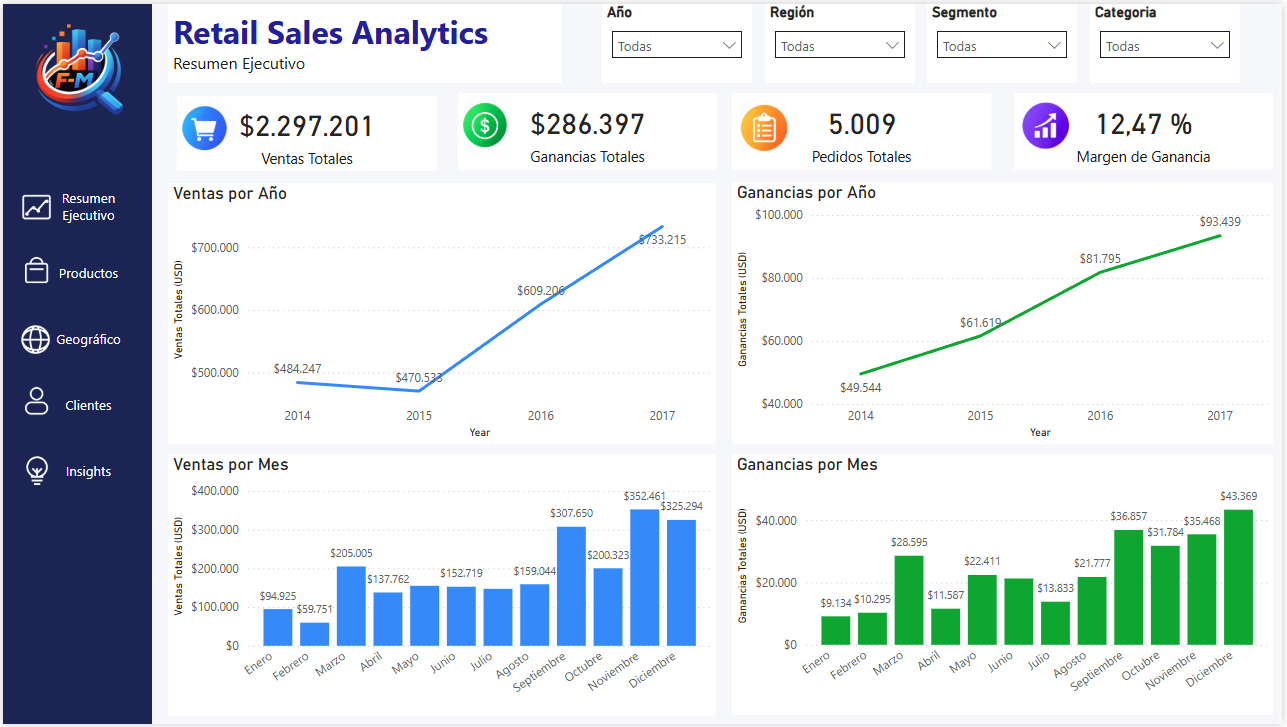
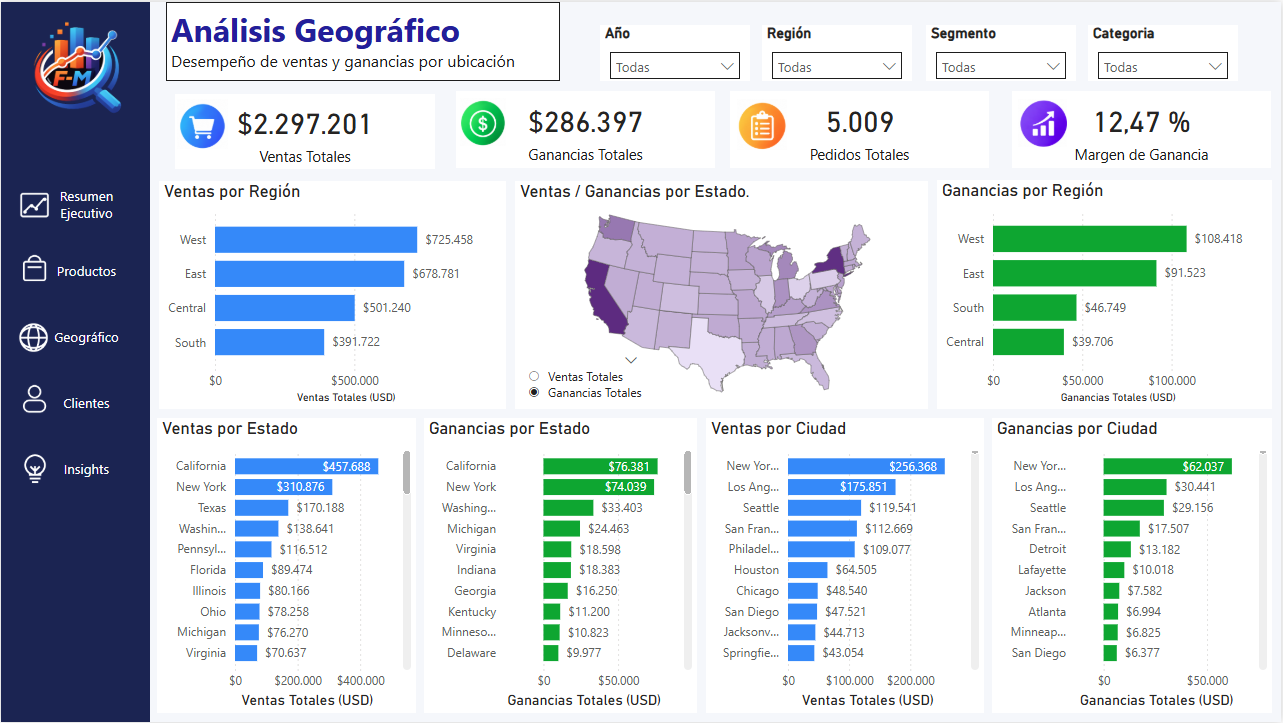
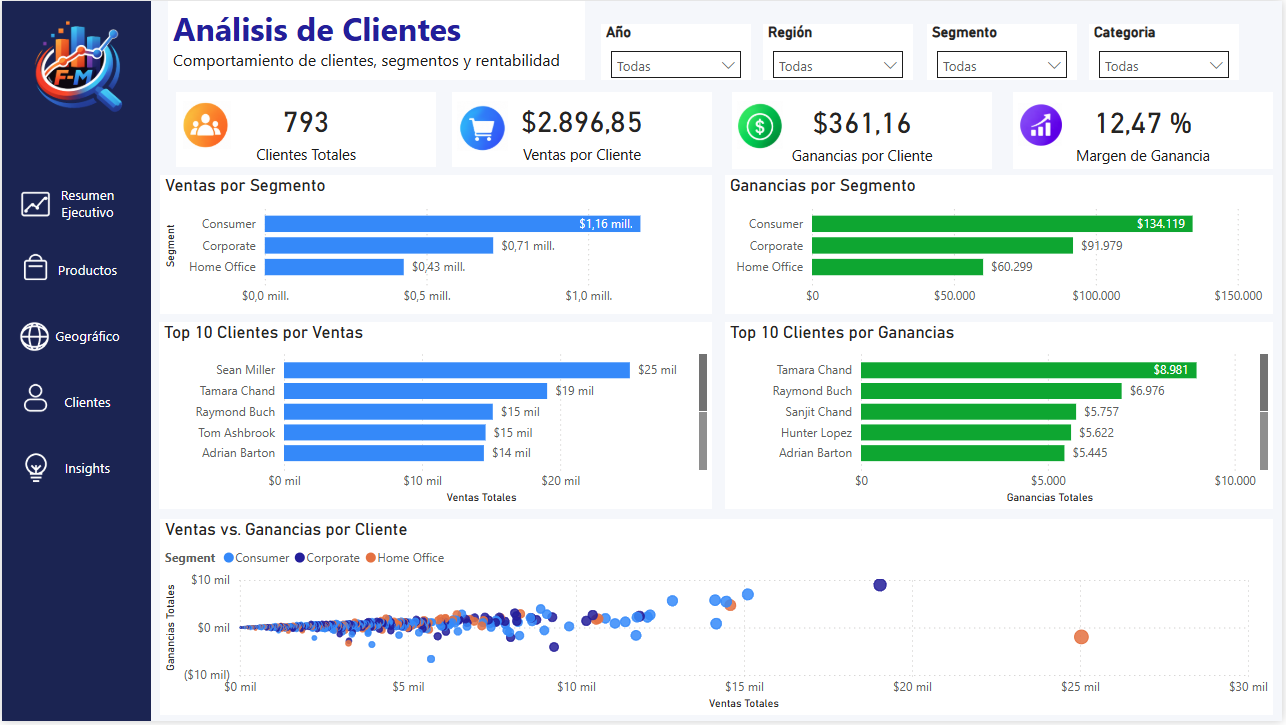
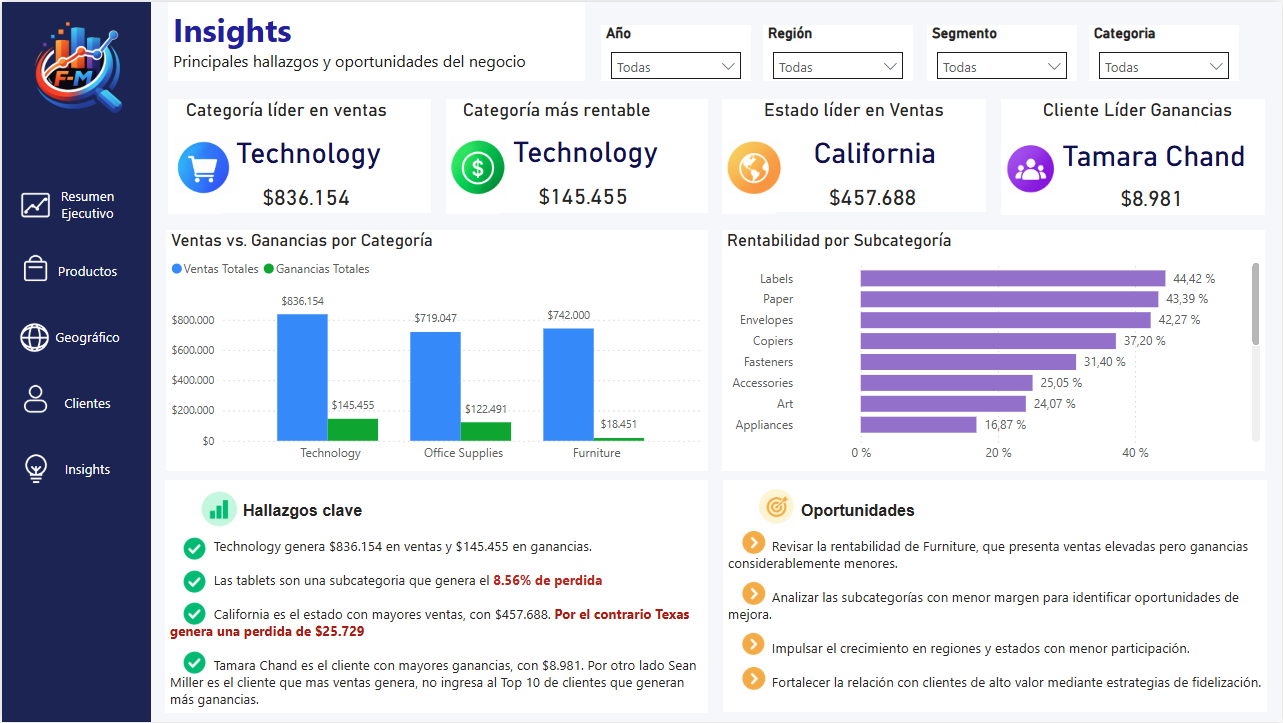
Interactive Power BI dashboard designed to analyze telecommunications performance, identify trends, and monitor key operational indicators.
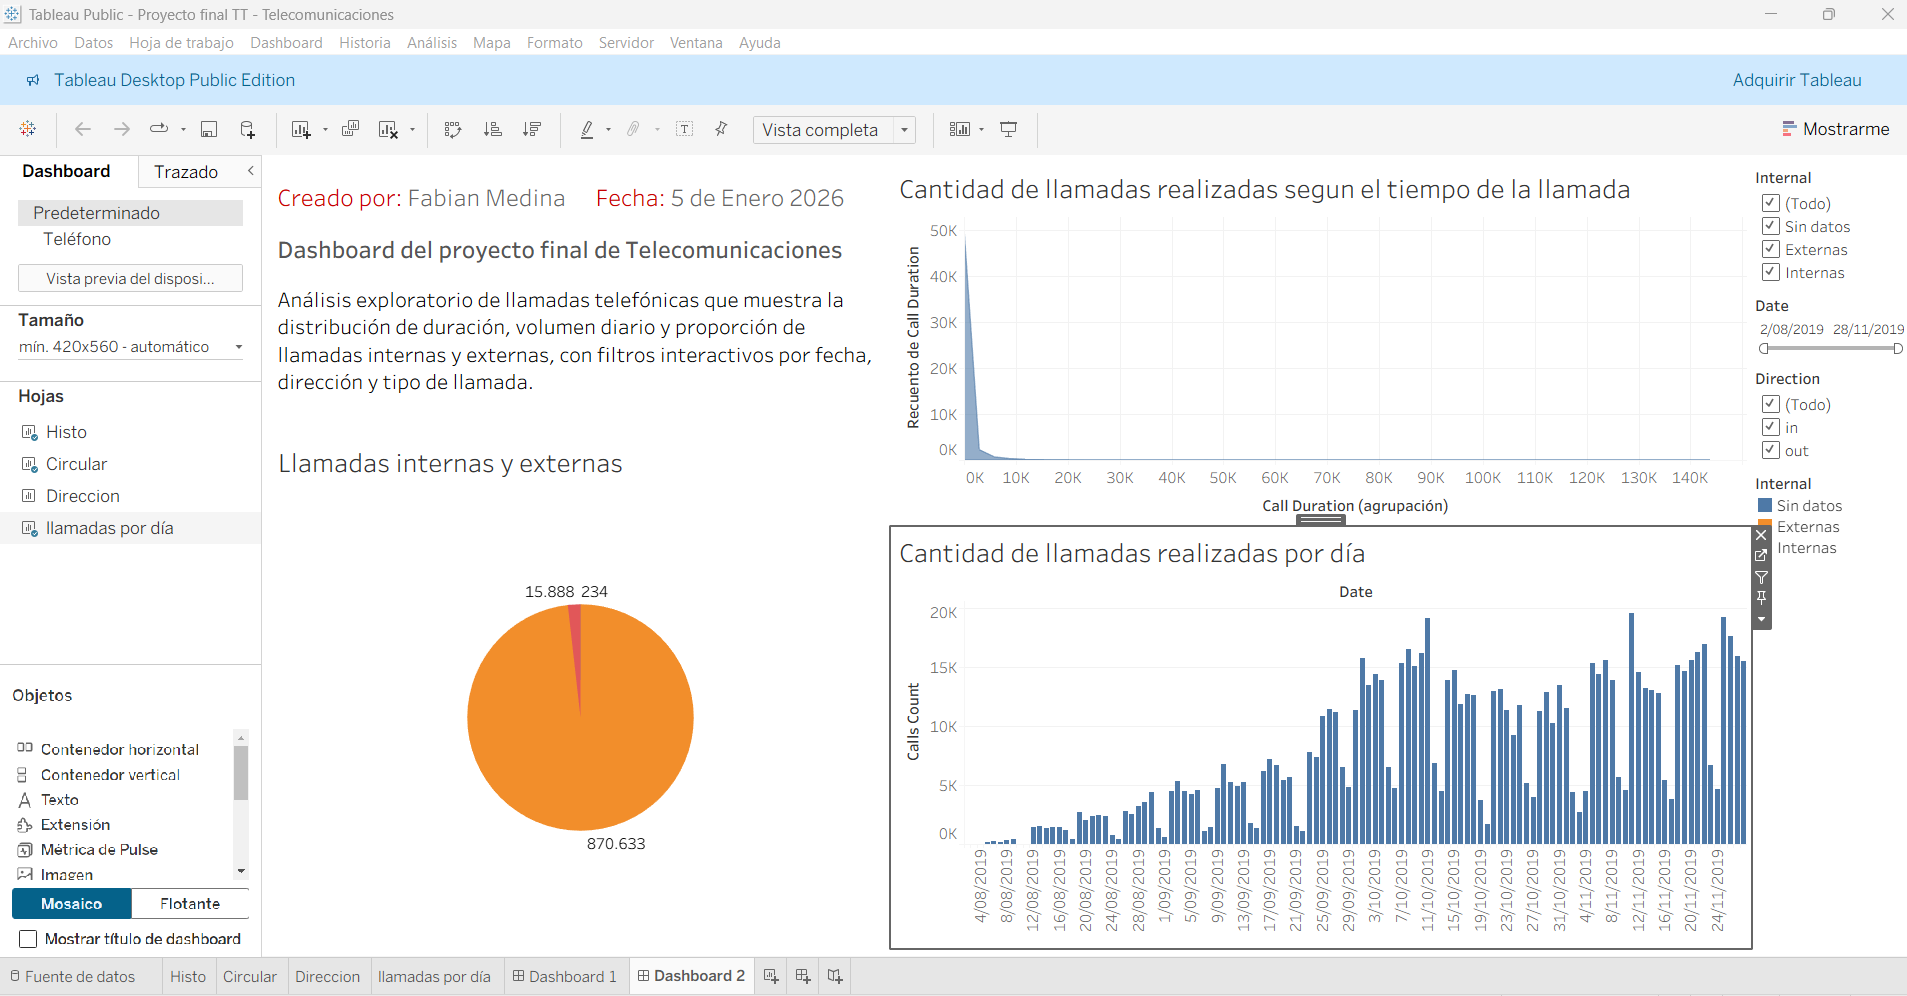
Interactive Tableau dashboard focused on data visualization, trend analysis, and presenting business insights through intuitive visualizations.